AI in the panel
Minecraft Server AI Performance Optimizer
Something is slowing your server down and the usual advice is to guess: lower the view distance, remove a plugin, buy more RAM. This measures instead. One button above your console reads the tick time, the tick rate, the processor and memory against your own plan, every loaded entity by type, the ticking chunks, the garbage collection, your plugins and who is online, and it comes back with one sentence naming the cause and the number behind it. Then it prepares the fixes as cards, and every one of them undoes in a click.
One sentence, with the number in it
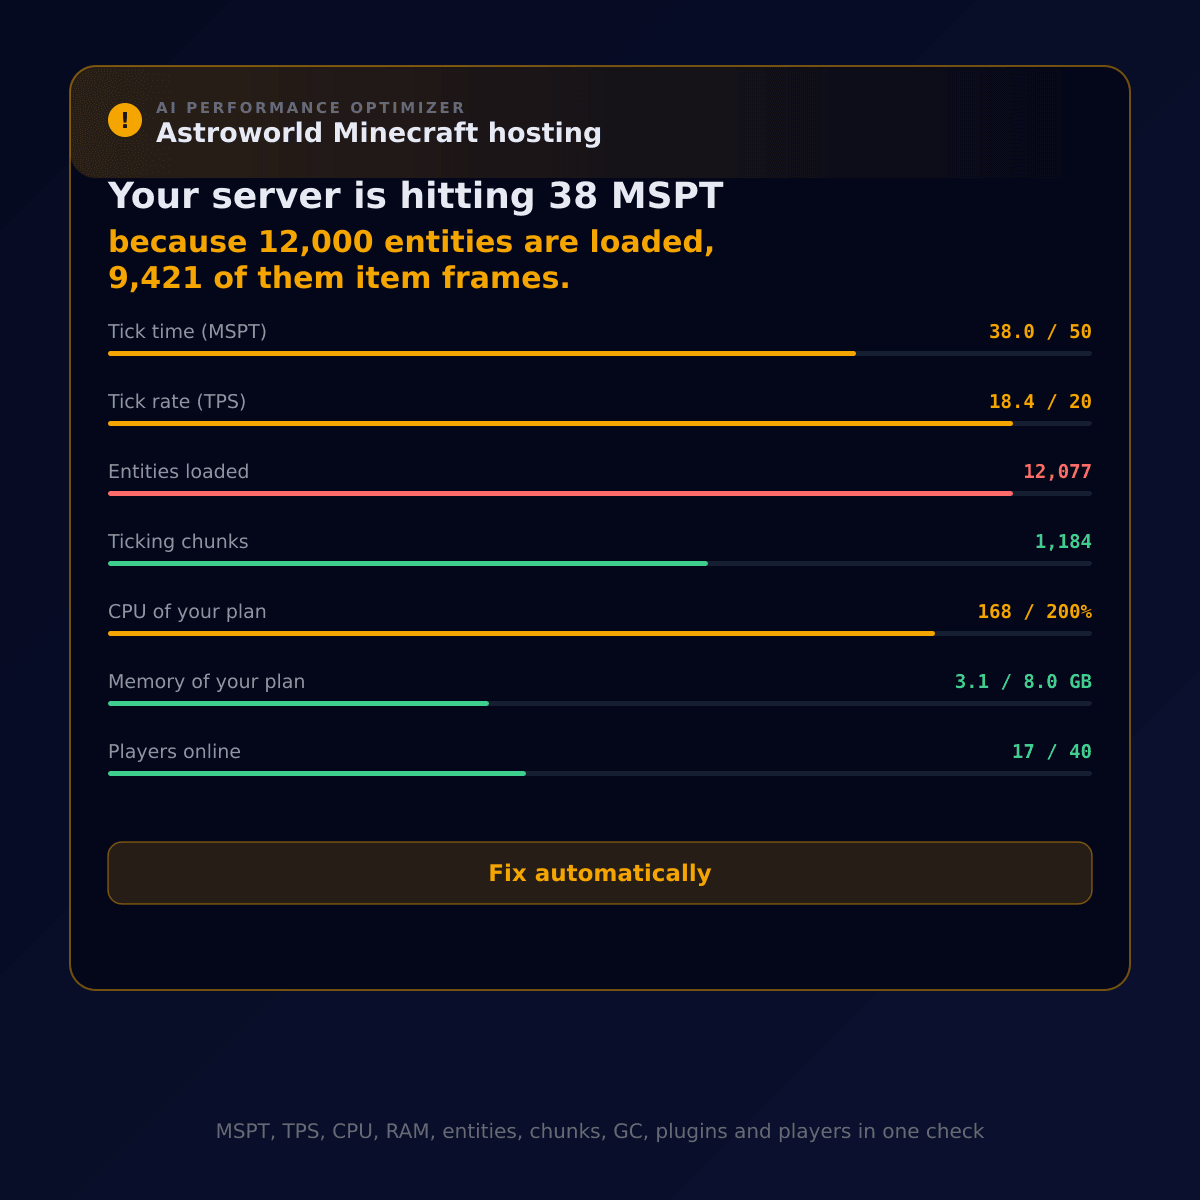
A performance answer is worth nothing if it does not connect the symptom to the cause. This one always does both in the same line: your server is hitting 38 MSPT because 12,000 entities are loaded, 9,421 of them item frames. The symptom on its own only confirms what you already felt. The cause on its own does not tell you what it is costing you. Together they tell you what to change and how much you get back.
Every figure in that sentence is measured on your own server at the moment you ask, and you can watch the check happen: the commands it sends appear in your live console like any other line, because that is exactly where they went.
What it measures, in one pass
Ten things, in about seven seconds, in a single check. That matters more than it sounds: an assistant that fetches these one at a time turns a simple lag question into dozens of steps and a bill to match. Here our own tools do the measuring and hand over a finished report, so the answer is fast, cheap and identical every time for the same server state.
| Measurement | What is read | Why it matters |
|---|---|---|
| MSPTMilliseconds per tick | How long one tick actually takes, over the last 5 seconds, 10 seconds and 1 minute, plus the single worst tick in that window. | This is the number that matters. A tick has 50 ms; everything above that is a tick the server did not finish in time. |
| TPSTicks per second | The tick rate over the last 1, 5 and 15 minutes. | 20 is perfect. TPS only drops once MSPT has already gone over budget, so it tells you it is bad, not why. |
| CPU | Live processor use of your container, measured against the limit of your plan and not against 100%. | A plan with 2 cores allows 200%, so 178% is busy and 6% is idle. We flag it from 90% of your own limit. |
| RAM | Memory in use against the memory your plan gives you. | From 90% the garbage collector starts eating tick time, and from 95% that is the first thing to fix. |
| EntitiesPer type, per dimension | Every loaded entity in the overworld, the nether and the end, counted per type, sorted heaviest first. | This is the most common real cause. Every entity is ticked every tick, so 9,000 item frames in one chunk is not a decoration, it is a bill. |
| Chunk loading | How many chunks are actually ticking around your players right now. | Chunks grow with the square of the view distance, so this number explains why one setting can double the work. |
| Garbage collection | Collection pauses, when your server writes them or when a profiler plugin can report them. | A long pause is a freeze for everyone online, even when the average tick looks healthy. |
| Plugins | Everything installed, plus which plugin is throwing errors in the recent log and how many. | A plugin erroring in a loop burns tick time while nothing looks broken from the outside. |
| Players | How many people are on, against your slot limit. | The same numbers mean different things with 0 players and with 40, so the report always says which it was. |
| Server log | How often the server logged that it could not keep up, that the watchdog stepped in, or that it ran out of memory. | This is the witness for lag that already happened, at a moment nobody was measuring. |
The thresholds we judge against, in full
Most performance advice never says at which number something becomes a problem, which makes it impossible to check. These are ours, and they are the same numbers the check itself judges on, so the page and the product cannot drift apart. They come from one place: a tick is 50ms, and everything below follows from that or from the limits of your own plan rather than from someone else's server.
| Threshold | How we rate it | Why this number |
|---|---|---|
| MSPT 50 or higher | Critical | A tick has 50 ms. Above that the server cannot hold 20 TPS, and the whole world runs slower than real time. |
| MSPT 33 to 50 | Warning | Two thirds of the tick budget is gone. Nothing is broken yet, but every peak now goes over 50 ms. |
| MSPT 25 to 33 | Worth knowing | Half the budget in use. Fine today, and the number to remember before you add players or plugins. |
| TPS below 19.5 | Warning | Below 15 we call it critical: at that point mobs, crops, redstone and hoppers are visibly slow to everyone. |
| CPU at 90% of your plan | Warning | At your own limit every extra piece of work turns straight into lag, so either the work goes down or the plan goes up. |
| RAM at 90% of your plan | Warning | From 95% it is critical: the collector runs almost constantly and every pause is a stutter. |
| 3,000 entities loaded | Warning | From 8,000 it is critical, and a single type above 800 is flagged on its own because that is a farm or a plugin, not normal play. |
| view-distance 12 or higher | Worth knowing | Each player loads (2 × distance + 1)² chunks, so 12 is 625 chunks against 289 at 8. |
| simulation-distance 8 or higher | Worth knowing | Simulation distance costs far more than view distance, because everything inside it is ticked and not just drawn. |
| 3× "can't keep up" in the log | Warning | A single plugin throwing 5 errors in the recent log is flagged too, because that costs tick time silently. |
Findings are ranked worst first, and the symptom is paired with the heaviest cause it measured. When nothing crosses a line, it says so and shows the numbers that prove it.
How a check runs, start to finish
Open the console and press one button
Above the live console of your server there is a line asking whether you are experiencing lag. It reads the output that is already on your screen, so if your server has just logged that it could not keep up, or memory is against your plan limit, that line turns into a warning with the number in it before you have asked anything.
It measures your live server, not a guess
The check takes about seven seconds. It reads the container statistics, your settings, your plugin folder and the recent log, and it asks the server itself for its tick times, tick rate, player list, mob caps and entity census. Everything it asks is read only, and you can watch every line of it appear in your own console while it happens.
It names the cause, with the number behind it
The answer opens with one line in the shape "your server is hitting 38 MSPT because 12,000 entities are loaded, 9,421 of them item frames". Symptom and cause in the same sentence, because the symptom alone tells you nothing you did not already feel, and the cause alone does not tell you how much it costs you.
The fixes come back as cards you apply
Cheapest and most reversible first: a setting before a plugin, a plugin before a restart. Each card shows exactly what changes, and above a set of cards there is a Fix automatically button that applies them in order. Every single change keeps its own undo, and one more button takes back everything from that message.
If nothing is wrong, it says nothing is wrong
A server measured under every threshold gets told so, with the numbers that prove it. It will not invent a problem to look useful, and it will tell you when it measured an empty server, because a baseline with nobody online is not a stress test.
What it can fix once it knows
Finding the cause is half of it. The same assistant can carry out the fix on the server the measurement came from, and it proposes the cheapest and most reversible one first.
| What it changes | Detail |
|---|---|
| Load settings | 63 settings in server.properties, plus the files where the settings that actually cause lag live: mob counts, spawn rates, entity ranges, despawn ranges and item despawn time. |
| View and simulation distance | The two numbers with the largest effect per player, changed with the before and after in front of you. |
| Entity and mob limits | Spawn caps and activation ranges, so a farm stops ticking the whole server instead of its own corner. |
| Plugins | Installs from a catalogue of 510 vetted plugins, for example a pre generator so exploring stops loading new chunks during peak hours. |
| Whole config files | When a change does not fit in one setting, it writes the complete file and keeps the old one for the undo. |
| A backup first | Before a series of changes it takes a backup, so there is always a way back that does not depend on any single undo. |
The settings people usually need for lag are not in the file everyone knows. Mob counts and spawn rates, entity ranges and despawn ranges live in the other configuration files of your server software, and the assistant goes to the right one instead of changing the one that is easy to find.
- Paper
- Purpur
- Spigot
- Folia
- Chunky
- Spark
- WorldGuard
- Multiverse-Core
- ViaVersion
- CoreProtect
Which engine runs the check
The optimizer is part of the AI Copilot, which has two engines. A check runs on Pulsar, the fast one, up to 8 steps, because our own tools already did the measuring and the model only has to read the report and write it up. When the fix is a job rather than a setting, for example rebuilding the load across several plugins at once, Quasar takes it and works through up to 30 steps in one message, checking the result of each before starting the next. On Auto the panel picks per message, so a check never costs you what a build costs.
Every server starts with 2,500 free credits, and the panel shows what a message cost the moment it finishes, so nothing is spent out of sight.
Questions about Minecraft server performance
What is MSPT, and what is a good MSPT?
MSPT is milliseconds per tick: how long your server needs to calculate one tick of the world. It gets 50 ms, because 20 ticks have to fit in a second. Under 25 ms is comfortable, 33 ms is where we start warning you because every peak now goes over budget, and at 50 ms the server can no longer hold 20 TPS. MSPT is the better number to watch than TPS, because it drops long before TPS moves.
My TPS says 20 but the server still feels laggy. How?
TPS is an average, and an average hides a spike. A server can sit at 20.00 TPS with a worst tick of 191 ms in the same window, and that single tick is the freeze your players actually felt. The check reports the worst tick next to the average for exactly this reason, and it counts how often the server logged that it could not keep up, so lag that happened an hour ago still shows up.
How many entities are too many on a Minecraft server?
We flag it from 3,000 loaded entities and call it critical from 8,000. A single type above 800 is flagged on its own even when the total is fine, because one type that far ahead of the rest is a farm, a breeder or a plugin spawning them, and that is a cause you can actually do something about.
What does a performance check cost?
Every server starts with 2,500 free Copilot credits, and one check runs on Pulsar, the fast engine, because our own tools do the measuring and the model only has to read the result. On Pulsar a full check plus the answer costs a few hundred credits, so the free credits cover several of them. The measurement itself is not billed separately; you pay for the message, not for the reading.
Does the check change anything on my server?
No. Every command it sends is a read only report command, and you can watch all of them appear in your own console while it works. Nothing is changed until you press Apply on a card, and even then every change keeps an undo. If you would rather it applied things itself, that is a separate setting you turn on yourself.
Does it work on any Minecraft server type?
The container figures, settings, plugin list and log are read on every server type. The tick numbers, entity census and mob caps come from the server software itself, so those come back fullest on Paper and Purpur, which is what most plugin servers run. On a type that does not report them, the check says which number it could not get instead of estimating it.
Why not just install a profiler plugin myself?
You can, and if you already have one the check reads its garbage collection figures too. The difference is that a profiler hands you a page of numbers and leaves the reading to you. This gives you one sentence naming the cause, ranked against thresholds that are the same every time, and the fixes ready to apply on the server the numbers came from.
Can I still fix lag myself?
Of course, and it is worth understanding what you are changing. Our written guide walks through the settings that matter and why, and this page and that guide are meant to be read together.
Where to find it
Open your server in the panel, go to the Console tab, and the line above the output is the way in. If your server has just logged that it could not keep up, or if processor or memory is against the limit of your plan, that line is already a warning with the figure in it before you click anything.
The optimizer is included with every plan at no extra cost, the same as the rest of the AI Copilot. If you would rather work through it yourself, the written guide to reducing Minecraft server lag covers the same settings by hand, and how much RAM you need answers the question people usually ask first. What is in every plan is listed on features.
There is a second pass on the same server that measures something else entirely: the AI security check runs 31 checks on who can join and who can run commands, which extra ports are open, your plugins, and the last 400 lines of your console. Slow and unsafe are different problems, and a server that has just been handed an operator it did not expect can look like a performance problem from the outside.
The thresholds, step limits, plugin count, settings count and free credit amount on this page are read from our own Copilot configuration when the page is built, so they change with the product instead of being written down twice. Written 30 August 2026.
Written and checked by the Astroworld Hosting team. Last reviewed on 6 September 2026.
Delivery: most servers are handed over instantly and run within seconds of payment, the rest follow within 60 minutes during the day and within 12 hours at night.